Hunter X Hunter
Hunter x Hunter is a popular TV show from Japan. On MyAnimeList, this is the second most favorited anime with roughly 200,000 people.
This show follows the adventures of a young boy named who sets out to become a skilled and licensed professional who is tasked with hunting down treasure, rare creatures, called “hunters”. The anime has become a fan favorite for its well-developed characters, intricate plotlines, and stunning visuals.
In this blog post, I will introduce a web app that allows users to search through all the subtitles of Hunter x Hunter and see how many times a certain term appears in each episode. This tool can be useful for fans of the show who want to study the dialogue and the development of the storylines, as well as for researchers who are interested in analyzing the language used in the anime.
Check out the website here.
Process
The first step in building this web app is to gather the data. I used web scraping techniques to obtain the list of episodes from Wikipedia and then converted it into a Pandas dataframe. I then downloaded a set of CSV files that contain the subtitles for each episode, and I looped through them to add them to the dataframe.
Once I had the data, I built a Streamlit app that allows users to input a term and get a count of how many times that term appears in each episode. I used string expressions and Pandas methods to search through the subtitles and extract the relevant information.
Finally, I used Plotly to create a dynamic graph that shows the frequency of the searched term throughout the series. This plot can be updated in real-time as the user changes the search term, allowing for a flexible and interactive experience.
Some Results
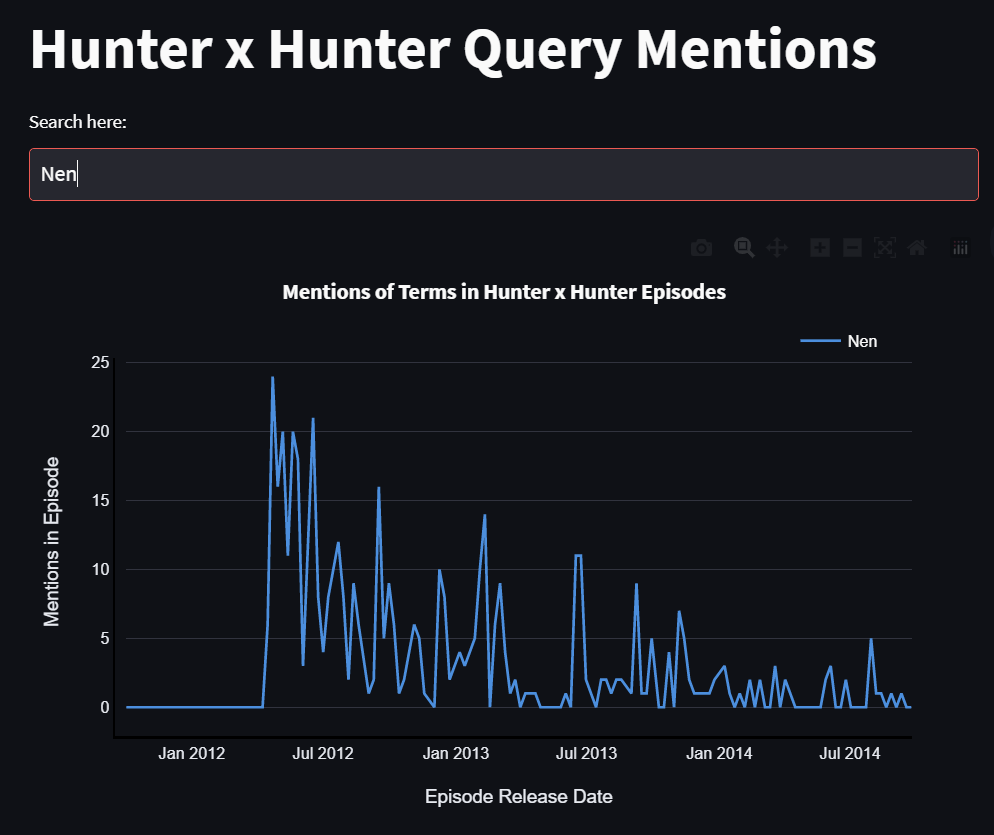
Here, we have the results from the term Nen.
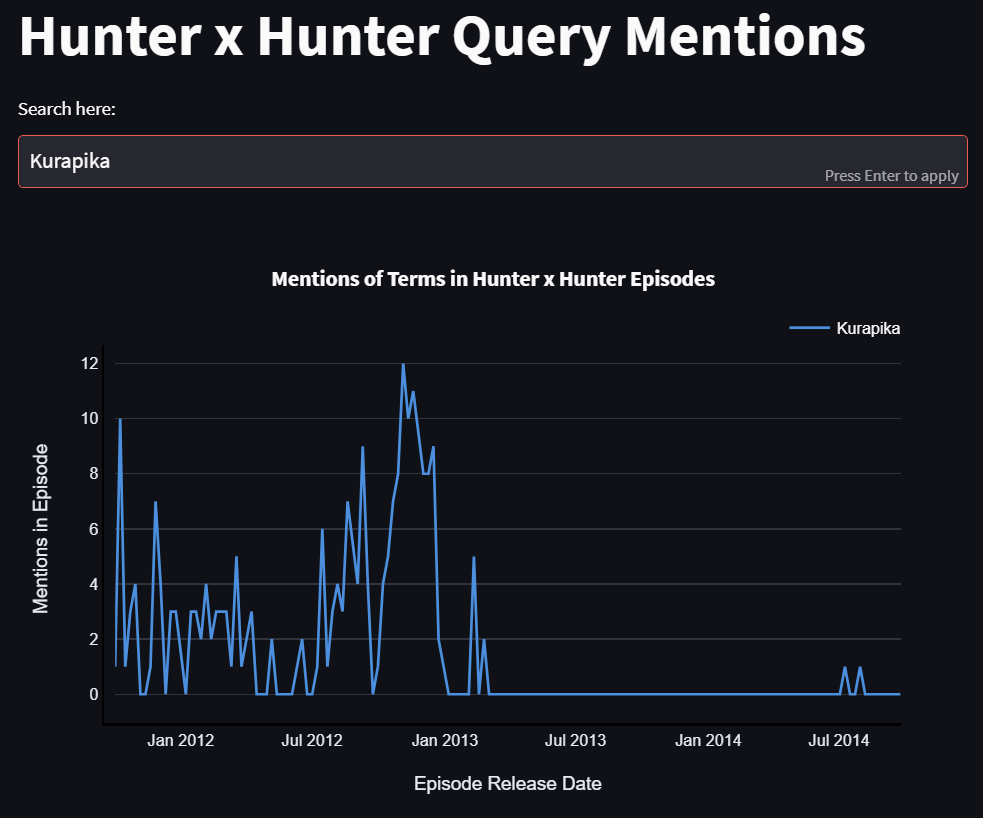
Results from the term Kurapika