State of American Christianity
General Social Survey
The General Social Survey (GSS) is a nationally representative survey of American adults that has been conducted since 1972. The GSS is conducted by the National Opinion Research Center (NORC) at the University of Chicago, and it is widely considered to be one of the most important sources of data on trends in American attitudes, beliefs, and behaviors.
Show the code
df_raw <- readxl::read_excel("GSS.xlsx")Rise of ‘None’
One of the key findings of the GSS is that Christianity in the United States is in decline. In the early 1970s, around 90% of Americans identified as Christian, but by 2020, that number had dropped to around 70%. This decline is particularly pronounced among young adults, with only around half of adults under the age of 30 identifying as Christian.
One of the main reasons for this decline is the rise of the “Nones” - a term used to describe people who do not identify with any particular religion. The number of Nones in the United States has been steadily increasing over the past few decades, and by 2020, around one in four Americans identified as Nones.
Show the code
df_raw %>%
  filter(str_detect(as.character(age), "^[0-9]+$")) %>%
  mutate(year = plyr::round_any(as.numeric(year), 10)) %>%
  mutate(across(everything(), ~replace(., . %in% c("Protestant","Catholic","Orthodox-christian") , "Christian"))) %>%
  mutate(across(everything(), ~replace(., . %in% c("Buddhism","Hinduism","Other eastern religions","Inter-nondenominational","Native american","Other","Muslim/islam") , "Other"))) %>%
  group_by(year, relig) %>%
  count() %>%
  filter(!relig %in% c(".n:  No answer", ".d:  Do not Know/Cannot Choose",".s:  Skipped on Web")) %>%
  group_by(year) %>%
  mutate(percent = round(n/sum(n),5)) %>%
  mutate(percent_label = (round(n/sum(n),2))*100) %>%
  mutate(percent_label = percent_label %>%  as.character() %>% paste0("%")) %>%
  ggplot(aes(x=as.numeric(year), y = percent, color = relig)) +
  geom_line(size = 1)+
  geom_point(size = 3.5) +
  labs(
    x = "Year",
    y = "Percent",
    color = "Religion",
    title = "Percent Religon Over Time"
  ) +
  ggrepel::geom_text_repel(aes(label = percent_label)) +
  scale_y_continuous(labels = scales::percent) +
  theme_bw()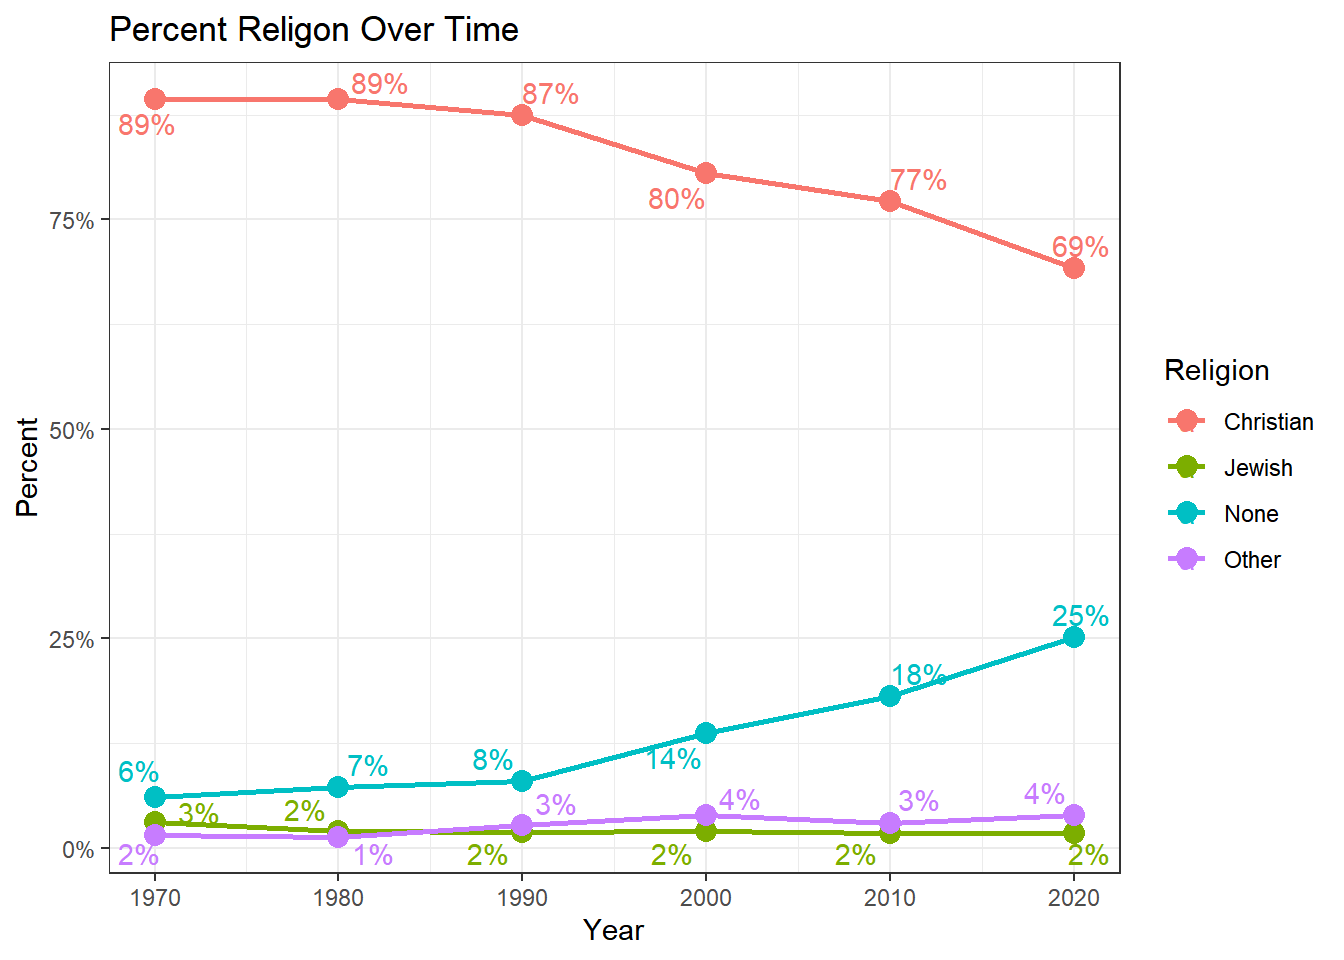
New Christians
While Christianity as a whole is in decline, the decline has not been evenly distributed across different denominations. Catholicism has remained relatively stable, with the proportion of Catholics in the U.S. population staying around 30% since the 1970s. On the other hand, the proportion of Protestants has seen a slight decline, dropping from around 55% in the 1970s to around 45% in 2020.
Other branches of Christianity, such as Mormonism, Jehovah’s Witnesses, and Eastern Orthodoxy, have seen an increase in recent years. By 2020, these denominations made up around 5% of the U.S. population, a significant increase from their representation in the 1970s.
Show the code
christian_vector <- c('PROTESTANT','CATHOLIC','CHRISTIAN','ORTHODOX-CHRISTIAN') %>% tolower()

df_raw %>%
  filter(str_detect(as.character(age), "^[0-9]+$")) %>%
  mutate(year = plyr::round_any(as.numeric(year), 10)) %>%
  filter(tolower(relig) %in% christian_vector) %>%
  mutate(across(everything(), ~replace(., . ==  "Orthodox-christian" , "Christian"))) %>%
  mutate(across(everything(), ~replace(., . ==  "Christian" , "Other"))) %>%
  group_by(year, relig) %>%
  count() %>%
  group_by(year) %>%
  mutate(percent = round(n/sum(n),5)) %>%
  mutate(percent_label = (round(n/sum(n),2))*100) %>%
  mutate(percent_label = percent_label %>%  as.character() %>% paste0("%")) %>%
  ggplot(aes(x=as.numeric(year), y = percent, color = relig)) +
  geom_line(size = 1)+
  geom_point(size = 3.5) +
  labs(
    x = "Year",
    y = "Percent",
    color = "Denomination",
    title = "Percent Christian Denomination Over Time"
    ) +
  ggrepel::geom_text_repel(aes(label = percent_label)) +
  scale_y_continuous(labels = scales::percent) +
  theme_bw()
Strength of Christians
Another aspect of the decline of Christianity in the United States is the weakening of its strength within the population. This can be seen in the decreasing participation in religious practices such as church attendance.
According to the GSS, the proportion of general Christians who do not attend church has increased from 15% in 1970 to 23% in 2020. Additionally, the proportion of Christians who attend church weekly has declined from 41% in 1970 to 36% in 2020. However, the proportion of Christians who attend church either monthly or less frequently has remained relatively stable.
This decline in church attendance is particularly pronounced among young Christians. The proportion of young Christians who attend church weekly or more frequently has decreased in all categories, except for the “seldom” category in which young Christians increased from 23% in 1970 to 45% in 2020.
Technical Note: This code is using the tidyverse and patchwork library to analyze and create a plot of church attendance among Christians over time. The code first filters the dataframe to only include rows where the “age” column contains numeric values, and then converts the “age” and “year” columns to numeric format. Next, it combines all Christian denominations as a single variable called “Christian”, and then filters to only Christians. The code replaces the several different categories of church attendance to Weekly, Monthly, Yearly, and Seldom. The code then groups and counts how many people in each category and uses “ggplot” to make a visualization.
Show the code
christian_attend <- df_raw %>%
  filter(str_detect(as.character(age), "^[0-9]+$")) %>%
  mutate(age = as.numeric(age)) %>%
  mutate(year = plyr::round_any(as.numeric(year), 10)) %>%
  mutate(age = plyr::round_any(as.numeric(age), 10)) %>%
  mutate(across(everything(), ~replace(., . %in% c("Protestant","Catholic","Orthodox-christian") , "Christian"))) %>%
  filter(relig == "Christian") %>%
  filter(!attend %in% c(".d:  Do not Know/Cannot Choose",".s:  Skipped on Web")) %>%
  mutate(attend = ifelse(attend %in% c("Every week","Nearly every week","Several times a week"), "Weekly", attend),
         attend = ifelse(attend %in% c("2-3 times a month","About once a month","At least monthly"), "Monthly", attend),
         attend = ifelse(attend %in% c("About once or twice a year","Several times a year"), "Yearly", attend),
         attend = ifelse(attend %in% c("Less than once a year","Never"), "Seldom", attend)) %>%
  group_by(year,attend) %>%
  count() %>%
  group_by(year) %>%
  mutate(attend = factor(attend, levels = c("Weekly", "Monthly", "Yearly","Seldom"))) %>%
  mutate(percent = round(n/sum(n),5)) %>%
  mutate(percent_label = (round(n/sum(n),2))*100) %>%
  mutate(percent_label = percent_label %>%  as.character() %>% paste0("%")) %>%
  ggplot(aes(x = year, y = percent, group = attend, color = attend)) +
  geom_line(size = 1)+
  geom_point(size = 3.5) +
  labs(
    x = "Year",
    y = "",
    color = "Attendance",
    title = "Church Attendance Among\nChristians Over Time"
    ) +
  ggrepel::geom_text_repel(aes(label = percent_label)) +
  theme_bw() + theme(legend.position = 'none')


df_christian <- df_raw %>%
  filter(str_detect(as.character(age), "^[0-9]+$")) %>%
  mutate(age = as.numeric(age)) %>%
  mutate(year = plyr::round_any(as.numeric(year), 10)) %>%
  mutate(age = plyr::round_any(as.numeric(age), 10)) %>%
  filter(!attend %in% c(".d:  Do not Know/Cannot Choose",".s:  Skipped on Web")) %>%
  mutate(attend = ifelse(attend %in% c("Every week","Nearly every week","Several times a week"), "Weekly", attend),
         attend = ifelse(attend %in% c("2-3 times a month","About once a month","At least monthly"), "Monthly", attend),
         attend = ifelse(attend %in% c("About once or twice a year","Several times a year"), "Yearly", attend),
         attend = ifelse(attend %in% c("Less than once a year","Never"), "Seldom", attend)) %>%
  filter(attend != ".n:  No answer") %>%
  mutate(attend = factor(attend, levels = c("Weekly", "Monthly", "Yearly","Seldom")))

christian_attend_youth <- df_christian %>%
  filter(age %in% c(20,30)) %>%
  group_by(year,attend) %>%
  count() %>%
  group_by(year) %>%
  mutate(percent = round(n/sum(n),5)) %>%
  mutate(percent_label = (round(n/sum(n),2))*100) %>%
  mutate(percent_label = percent_label %>%  as.character() %>% paste0("%")) %>%
  ggplot(aes(x = year, y = percent, group = attend, color = attend)) +
  geom_line(size = 1)+
  geom_point(size = 3.5) +
  labs(
    x = "Year",
    y = "",
    color = "Attendance",
    title = "Church Attendance Among\nChristian Youth Over Time"
    ) +
  ggrepel::geom_text_repel(aes(label = percent_label)) +
  theme_bw() +
  theme(
    # legend.position = 'bottom',
    legend.direction = "vertical"
    )


christian_attend + christian_attend_youth & scale_y_continuous(limits = c(.1, .46),labels = scales::percent)
Strength of Protestants
While overall Christianity in the United States is in decline, the decline has not been evenly distributed across different denominations. In particular, the decline of Protestant Christianity appears to be less pronounced than that of Christianity as a whole.
When it comes to church attendance, the data shows that weekly attendance among Protestants has remained relatively stable. According to the GSS, the proportion of Protestants who attend church weekly has remained around 35% since 1970. Furthermore, the weekly attendance for both general Protestants and young Protestants actually increased slightly.
Show the code
prot_attend <- df_christian %>%
  filter(relig == "Protestant") %>%
  group_by(year,attend) %>%
  count() %>%
  group_by(year) %>%
  mutate(percent = round(n/sum(n),5)) %>%
  mutate(percent_label = (round(n/sum(n),2))*100) %>%
  mutate(percent_label = percent_label %>%  as.character() %>% paste0("%")) %>%
  ggplot(aes(x = year, y = percent, group = attend, color = attend)) +
  geom_line(size = 1)+
  geom_point(size = 3.5) +
  labs(
    x = "Year",
    y = "",
    color = "Attendance",
    title = "Church Attendance Among\nProtestants Over Time"
    ) +
  ggrepel::geom_text_repel(aes(label = percent_label)) +
  theme_bw() +  theme(legend.position = 'none')

prot_attend_youth <- df_christian %>%
  filter(relig == "Protestant") %>%
  filter(age %in% c(20,30)) %>%
  group_by(year,attend) %>%
  count() %>%
  group_by(year) %>%
  mutate(percent = round(n/sum(n),5)) %>%
  mutate(percent_label = (round(n/sum(n),2))*100) %>%
  mutate(percent_label = percent_label %>%  as.character() %>% paste0("%")) %>%
  ggplot(aes(x = year, y = percent, group = attend, color = attend)) +
  geom_line(size = 1)+
  geom_point(size = 3.5) +
  labs(
    x = "Year",
    y = "",
    color = "",
    title = "Church Attendance Among\nProtestant Youth Over Time"
    ) +
  ggrepel::geom_text_repel(aes(label = percent_label)) +
  theme_bw() +
  theme(
    # legend.position = 'bottom',
    legend.direction = "vertical"
    )


prot_attend + prot_attend_youth & scale_y_continuous(limits = c(.1, .42),labels = scales::percent)
Strength of Catholics
While Christianity as a whole is in decline, the decline has not been evenly distributed across different denominations. Among all Christian denominations, the Catholic Church appears to be the one that has been most affected by the decline in attendance.
According to the GSS, weekly attendance among Catholics has decreased significantly since 1970. Among general Catholics, weekly attendance dropped from 53% to 27% during this time period. Similarly, weekly attendance among Catholic youth has also decreased, declining from 40% in 1970 to 15% in 2020.
However, the decline in attendance has not been limited to weekly attendance. The proportion of Catholics who attend church seldom or less frequently has also increased. Seldom attendance increased from 11% in 1970 to 26% in 2020. Furthermore, the youth seldom attendance doubled from 12% to 24% in 2020.
Show the code
cath_attend <- df_christian %>%
  filter(relig == "Catholic") %>%
  group_by(year,attend) %>%
  count() %>%
  group_by(year) %>%
  mutate(percent = round(n/sum(n),5)) %>%
  mutate(percent_label = (round(n/sum(n),2))*100) %>%
  mutate(percent_label = percent_label %>%  as.character() %>% paste0("%")) %>%
  ggplot(aes(x = year, y = percent, group = attend, color = attend)) +
  geom_line(size = 1)+
  geom_point(size = 3.5) +
  labs(
    x = "Year",
    y = "",
    color = "Attendance",
    title = "Church Attendance Among\nCatholics Over Time"
    ) +
  ggrepel::geom_text_repel(aes(label = percent_label)) +
  theme_bw() + theme(legend.position = 'none')

cath_attend_youth <- df_christian %>%
  filter(relig == "Catholic") %>%
  filter(age %in% c(20,30)) %>%
  group_by(year,attend) %>%
  count() %>%
  group_by(year) %>%
  mutate(percent = round(n/sum(n),5)) %>%
  mutate(percent_label = (round(n/sum(n),2))*100) %>%
  mutate(percent_label = percent_label %>%  as.character() %>% paste0("%")) %>%
  ggplot(aes(x = year, y = percent, group = attend, color = attend)) +
  geom_line(size = 1) +
  geom_point(size = 3.5) +
  labs(
    x = "Year",
    y = "",
    color = "Attendance",
    title = "Church Attendance Among\nCatholic Youth Over Time"
    ) +
  ggrepel::geom_text_repel(aes(label = percent_label)) +
  theme_bw() +
  theme(
    # legend.position = 'bottom',
    legend.direction = "vertical"
    )


cath_attend + cath_attend_youth & scale_y_continuous(limits = c(.1, .54),labels = scales::percent)
Charting the decline
In conclusion, this blog post has discussed the decline of Christianity in the United States over the past few decades, as reported by the GSS. The data shows that the proportion of Christians in the U.S. population has dropped from around 90% in the early 1970s to around 70% in 2020.
The decline of Christianity is also reflected in the weakening of its strength within the population, as seen in the decreasing participation in religious practices such as church attendance. The proportion of general Christians who do not attend church has increased from 15% in 1970 to 23% in 2020 and the proportion of Christians who attend church weekly has declined from 41% in 1970 to 36% in 2020. However, the proportion of Christians who attend church either monthly or less frequently has remained relatively stable.
When looking at different Christian denominations, the decline of Protestant Christianity appears to be less pronounced than that of Christianity as a whole. The proportion of Protestants who attend church weekly has remained around 35% since 1970, and weekly attendance for both general Protestants and young Protestants actually increased slightly. On the other hand, the Catholic Church appears to be the one that has been most affected by the decline in attendance. Among general Catholics, weekly attendance dropped from 53% to 27% during this time period, and the youth seldom attendance doubled from 12% to 24% in 2020.
The term “Chreaster” is defined as such: “A Christian who does not frequently attend church, attending only on the major holidays of Christmas and Easter.” (Wiktionary) Chreasters have been on the increase especially among younger Christians and Catholics.
While this blog post does not try to explain the ‘why’ in this phenomenon, there are several factors that readers can probably think of that have led to this decline. Some of the possible factors include the increasing secularization of American society, the rise of social media and the internet, the growing diversity of American society, the sexual abuse scandals that have plagued the Catholic Church, and the loss of trust and credibility among Catholics.